Intelligence Report — October 2018 Issue
The Unlikely Best Quarter of 2018
As I sat to write this month’s issue, we were just about to close the books on the third quarter. Now, with all the negative trade war headlines, political intrigue, high-profile CEO shenanigans and even an interest rate hike by the Federal Reserve, the third quarter turned out to be the best-performing quarter for stocks this year.
In fact, we saw broad gains in the major domestic equity indices, gains driven by strong economic data, solid earnings growth and improved clarity on global trade. Yet perhaps not surprisingly, those positive factors often were overlooked, as news headlines focused on various political firestorms and the continued uncertainty with regards to the U.S.-China trade relationship.
But in what has become a recurring theme for the 2018 market, positive economic and corporate fundamentals once again outweighed the admittedly unnerving political headlines. Starting with current economic growth, it’s simply the best we’ve seen in years.
The final reading of second-quarter Gross Domestic Product (GDP) showed growth above 4% annually. According to the Atlanta Federal Reserve GDP Now estimates, we can expect a similarly strong number for the third quarter. To put that in its proper context, the last time the U.S. economy posted two consecutive quarters of GDP growth above 4% (when there wasn’t an ongoing quantitative easing program boosting economic activity) was 15 years ago, during the third and fourth quarters of 2003.
Corporate earnings growth also remained very strong during the third quarter, as more than 80% of S&P 500 companies reported earnings above consensus expectations. According to financial data firm FactSet, that’s a record high.
Those broad earnings gains were largely fueled by the Trump tax cuts passed at the end of 2017, and with that firm tailwind still at its back, S&P 500 corporate earnings growth for 2018 is expected to rise above 20% year over year! And, just as importantly, analysts expect strong earnings growth to persist into 2019, with current estimates calling for 14% earnings growth for the S&P 500 next year.
As for the boogeyman of global trade tensions, we still have persistent concerns about the U.S.-China trade relationship. However, the third quarter also saw important resolutions on numerous other trade situations. First, in July, the United States and European Union reached a trade agreement that would prevent retaliatory tariffs and promised to investigate ways to further promote free trade between the two powers.
Then, in August, the United States and Mexico agreed to a trade framework to replace the North American Free Trade Agreement (NAFTA). As of this writing, negotiations continue with Canada to have that country join the new U.S.-Mexico agreement.
This is important. Recall that as we began the third quarter, we had four areas of trade-related concerns: the European Union, Mexico, Canada and China. Positively, we begin the fourth quarter with just one area of legitimate trade concern, i.e. China.
And even on that still-contentious front, the U.S.-China trade relationship has improved. The recent imposition of a 10% tariff on $200 billion of Chinese imports was far less than the anticipated 25% tariff on $200 billion. We also saw a rather modest retaliatory move from China, with tariffs on just $60 billion of U.S. imports.
Now, the risk to the economy and markets posed by the U.S.-China trade situation is by no means gone. In fact, this one unknown still represents the biggest single risk to the U.S. economy and markets. Yet, it’s important to remember that so far in 2018, the underlying fundamental market support pillars of a strong economy and healthy corporate fundamentals have powered stocks higher through multiple periods of trade, political and international uncertainty — and that’s critical context to consider as we enter the final quarter of the year.
As for market segment performance in the third quarter, we saw a departure from the first two quarters of the year. In Q3, large-cap stocks (broadly speaking) outperformed small caps. Similarly, value stocks.
outperformed growth for the first time this year. Both of those changes in performance are representative of the reduction in global trade risks, as large caps broadly, and value sectors specifically, underperformed during the first two quarters on trade concerns.
On a sector level, all 10 Standard and Poor’s market sectors finished the third quarter in positive territory. Health care and industrials outperformed the S&P 500 thanks to strong earnings from health care facilities, while industrials were aided by a reduction in trade tensions.
Conversely, the energy and materials sectors fought headwinds from a stronger U.S. dollar early in the third quarter. That caused both sectors to relatively underperform the S&P 500 Index. The remaining S&P market sectors generally tracked the S&P 500 Index from a return standpoint.
So, what’s in store for the fourth quarter?
As things stand now, U.S. economic and corporate fundamentals remain robust, and those two factors likely will continue to provide strong support for the markets. The strength of these two bull market drivers have helped markets power higher in 2018, despite a return of volatility. And, I fully expect continued market volatility in the fourth quarter, as we still face several potentially significant unknowns.
Three such unknowns we all should be watching are A) Will the United States and China strike a trade deal? B) Does corporate earnings growth continue to meet expectations? C) Will there be any major disruptive political events from Washington (personnel turnover, midterm election tumult, Special Counsel intrigue).
It’s unclear how, or when, these events will be resolved, and what the implications will be for markets. Yet as 2018 has shown us so far, uncertainty is not, by itself, enough to offset the strong fundamentals in the U.S. economy and corporate America.
Also remember that markets always face uncertainties at the start of every quarter, but over the long term, it is core economic and corporate fundamentals that drive market returns, not the latest sensational headlines.
The key for you, the investor, is to make sure your investment positions are in line with your goals. And, to make sure you’ve positioned your capital so that you are building long-term positions in some of the strongest, high-barrier-to-entry companies with a long track record of outstanding earnings growth, increased dividends and long-term share-price appreciation.
Whether you do this with individual stocks, mutual funds or exchange-traded funds (ETFs), your goal should be to invest for the long term, with a strategy that mitigates risk through diversification and that puts the power of compounding on your side.
Introducing a Streamlined Income Multipliers Buy List
One of the consistent questions I get from subscribers is what the best Income Multipliers are to buy now. That question traditionally has been answered via a section we call “Top 10 Common Stocks to Buy Now.” This section is aimed at investors looking to put new money to work in the market, and the picks come from our master list of equities on the Income Multiplier list (available on the website).
Yet for many subscribers, questions remain about this list. First, many want to know how many overall stocks they should own. They also want to know how many stocks are current buys, and how many are current holds. In short, I think there is a little confusion about the Income Multipliers list, but I hope any questions will be cleared up after this month’s issue.
The way I see it, all the securities on the master list of Income Multipliers represent the kind of securities you want to own in a well-diversified, incomegenerating portfolio. Yet, it’s hard to own all the stocks listed here, as there are nearly 90 to choose from, and of that 90, some 40 are listed as “buys.”
Now, I am of the opinion that this is way too many stocks for an individual to own, since having so many positions is a clerical nightmare, as well as just too many positions to keep track of in any deep way. It is one thing to own some 40, or even 90, positions or more in a mutual fund or ETF. Yet owning so many positions is just not recommended for an individual.
So, how many stocks is right? Well, that’s largely a personal decision based on your comfort level, but in general I would say that owning 20 individual stocks in a portfolio designed for income generation is more than enough. In fact, holding more than 20 positions can be way too cumbersome for most investors to handle. Moreover, it’s just not necessary, as you can get the same, if not better, results by concentrating your holdings.
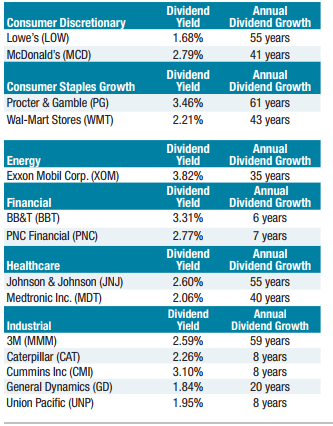
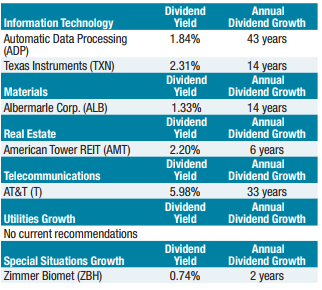
That’s why this month, I am introducing a new, streamlined Income Multipliers buy list. This list will consist of what I think are the stocks you should own right now, and those that are suitable for new money. Think of this list as a hybrid of the monthly Top 10 Common Stocks to Buy Now, and master list of Income Multipliers. In other words, this is the best 20 stocks both to buy now, and the best to own in a diversified income-generating portfolio. I call this portfolio simply, the “Top 20 Income Multipliers.”
On Pages 4 and 5, you’ll find two-year charts of each of the Top 20 Income Multipliers. These are the stocks that are suitable for new capital, and stocks to own if you were to pare down your current holdings and make your portfolio more streamlined.
That’s not to say that the other stocks on the Income Multipliers master list are bad or should be avoided. Far from it. Rather, these are the 20 stocks that I think should be a part of any strong, long-term income portfolio.
These stocks come from different market sectors, and they are in diverse industries. Yet what they have in common is a strong position in their respective markets, strong earnings growth over the years, a long history of increasing annual dividends, an attractive dividend yield and good prospects for continued upside in terms of share-price appreciation.
Each month, I will update this list with news, earnings, or other industry developments that materially affect these stocks. I also will have charts and performance news. And, of course, this list will not remain constant. It will be subject to constant revision, as we will remove some stocks and add others as market conditions dictate.
Below is our inaugural list of the Top 20 Income Multipliers.
And Then There Were Three…
In the June issue, I introduced you to what I called my new favorite economic indicator, one that’s both unique and well-reasoned, and one that I suspect will give us a much better macro picture of the economy and the likely future of market direction.
This indicator comes to us from my friend and colleague, macro-analyst extraordinaire, Tom Essaye of the Sevens Report. Tom calls this indicator the “Economic Breaker Panel,” because just as a breaker panel in your house “trips” when there’s a problem, so too will each of the economic indicators included in this indicator. And like a real breaker panel, the more indicators that have “tripped,” the bigger the problem.
In August, the Economic Breaker Panel index saw a third breaker trip, Light Truck Sales, as the three-month rolling averages turned negative. That joins Building Permits (still declining) and copper (at multi-year lows) as economic breakers that have tripped. Additionally, a fourth breaker, Real Interest Rates, is likely to trip if the Fed raises interest rates in December. That means we could soon see four of 10 breakers “tripped,” and while economic activity remains undeniably robust right now, clearly the outlook is dimming a bit.
The Economic Breaker Panel is divided into three categories: Macro Indicators, Economic Indicators and Market Indicators
Macro Indicators: 10’s-2’s, Real Interest Rates. Here we are looking for outright inversion of the 10’s-2’s spread and positive real interest rates as conditions that would “trip” the economic breaker and serve as a warning. Update: The 10’s-2’s spread hit fresh new lows in August below 0.2% but has since bounced slightly. Meanwhile, real interest rates (Effective Fed funds minus 5-Year TIPS/ Treasury Breakeven Rate) is just 5 basis points, and that number could turn positive soon if the Fed hikes rates. Takeaway: No macro breaker tripped, but we’re getting very close on real rates.
Economic Indicators: Light Truck Sales, 12-Month Total Vehicle Miles Traveled, Avg. Work Week, Jobless Claims, Building Permits, New Orders for Non-Defense Capital Goods Ex Aircraft. Here we’re looking for multi-month declines to imply a rollover of the economic trend, or, for 12-month total vehicle miles traveled, a yearover-year decline. Update: Building permits got even more concerning as it was more negative on a rolling three-month basis. Additionally, Light Truck Sales now are negative on a three-month basis. Light truck sales are not a widely followed economic indicator, but they provide a good anecdotal view into current economic trends. Put simply, the U.S. economy is still powered by small business, and there’s very little small (or even medium) business that does not use a truck. Takeaway: Two economic breakers tripped.
Market-Based Indicators: Brent Crude & Copper. Copper and crude oil can act as coincident or leading indicators of economic activity, and multi-month lows in either are concerning. Update: Copper remains near one-year lows on growing fears that the U.S.-China trade dispute will disrupt the global recovery, and we take this price action as a “caution” sign on global growth. Takeaway: One market-based breaker tripped.
Still, despite the tripping of three, and likely soon four, breakers, that doesn’t mean that stocks are heading lower in the medium term. Markets can definitely continue to rally while economies lose momentum. That’s what happened in 1998-1999, and again in 2006-2007. That said, the breaker panel should serve as an important reminder that we’re still approaching the peak for economic activity in this cycle. As such, we need to remain vigilant toward any downward momentum.
Mind the Gap between the United States and Emerging Markets
If you’ve ever been to London and rode the Underground, a.k.a. “the tube,” you’ve seen the signs that warn you to “Mind the gap.” The admonition is just a reminder to take caution while crossing the spatial gap between the train door and the station platform.
In markets, sometimes “gaps” develop that we also must mind, and one such gap that’s developed in 2018 is the one between the United States and emerging markets since May. That gap now is unsustainably wide, and how that gap closes largely will determine how stocks trade into the year’s end.
The chart on page 8 in the PDF version shows the near-25% performance gap between the total return on the S&P 500 Index and the total return on the iShares MSCI Emerging Markets ETF (EEM). The reason this is so important has to do with recent history, since the last time we saw a near-25% performance gap between the S&P 500 and the emerging markets was during the summer of 2015.
That gap foreshadowed two very nasty, near-15% pullbacks in U.S. stocks in August/September of that year, and again in January/December 2016. So, the gap must close in either a positive or negative way for stocks.
So, which way will the gap go this time? Well, there are two potential scenarios on how this gap will play out. Starting with the bad news first, the negative scenario is a repeat of late 2015-early 2016. During that time, weakness in the emerging markets eventually acted as an anchor on the stock market, causing significant volatility for six-plus months.
The positive scenario is easier, and more likely, and that’s because it only requires an extension of what we’ve seen over the past several weeks, as emerging market stresses across multiple fronts (U.S.-China trade and China’s economic growth) have improved.
In fact, for the positive scenario to occur, we just need to see: 1) Continued improvement in U.S.-China trade talks (that’s happening) 2) Stillsolid Chinese economic data, 3) Emerging market currency stability (that’s also happening) and 4) Solid global growth. In this scenario, we would see emerging markets, foreign markets and commodities rally and close the gap with the S&P by outperforming.
If this positive scenario takes place, it could present us with new investing opportunities in our Tactical Trends Portfolio.
The Financial Crisis Turns 10
If you had money in the markets 10 years ago, you likely vividly recall the collapse of Lehman Brothers. The fantastically swift implosion of one of the most-prestigious financial institutions on Wall Street happened a decade ago.
Since then, the market has made a remarkable comeback. Consider that over the past 10 years, the total return on the S&P 500 has roared back nearly 190%! This shows not only the resilience in the American financial system, it also shows the resolve of investors to get back in the fight after a devastating defeat.
Yet maybe the most important thing to remember about the financial crisis 10 years gone is that things have a way of returning when we least expect it. And, though the course of those things/events may be altered, the river always finds its way back to the sea.
That’s what rivers do, and that’s what markets do.
At some point, we can expect another destructive market meltdown. At some point, we will have to deal with the detritus of systemic financial loss. It may take another 10 years, or it may come far sooner or far later.
The best thing we can do, as investors and prepared citizens, is to make sure our own financial and security concerns are in the best shape they can be. That means having diversified equity and fixed-income exposure such as the sort we have in this service.
It also means avoiding the accumulation of excessive personal debt, avoiding bad financial mistakes, and making sure we are prepared for the worst-case scenario even if that day defies the odds and never comes.
In the name of the best within us,

Jim
Read the PDF version of this issue of Intelligence Report here.
Please note that the issue requires the free Adobe Acrobat Reader for viewing and printing. If you don’t already have this software, it can be downloaded here.
P.S. Today, you can get shares of a former tech titan at a 95% discount to its historical high. Usually, a price plunge like that indicates a company is on its last legs… but not here. That’s because one well-known investor has been betting HUGE on this left-for-deaaaaaaad tech play. When an investor of this man’s stature puts that much “faith” into one investment, it’s one of the strongest indicators you’ll ever find for identifying stocks about to soar. To discover the name of this company, and the man who’s plunked down more than half a billion dollars on its rebound, click here now.
Search